Digital camera came with one of the most useful feature, which is called instant review of image. Almost every photographer is in a habit to review the image immediately after it is clicked. But how are we so sure that the reproduced image displayed in the LCD screen is accurate in terms of proper exposure value. What if the image is under exposed and the brightness of your LCD is more than the normal. The under exposed image will look proper, which will not be the case when you take the same file into the computer. It might also be possible that you are viewing the image in bright sunlight or extremely dark condition, both the conditions ambient light will have impact on your reproduced image viewing experience. The LCD screen is a great help to confirm the composition, sharpness, focus etc. For exposure confirmation almost all the camera is equipped with another feature which is called Histogram. 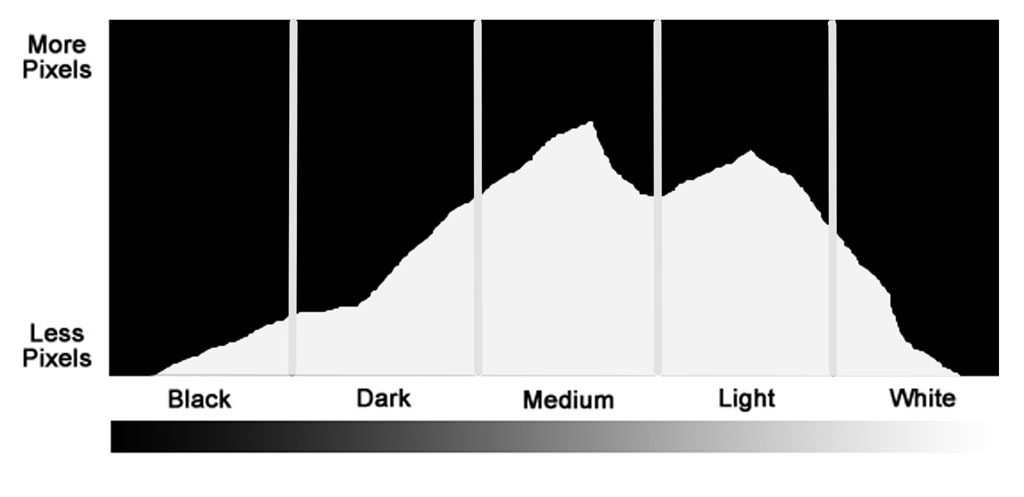
Histogram is a graphical representation of the exposure value of the image. The white histogram in a camera contains all the brightness value of your image. The horizontal axis of the histogram represents the brightness values. From pure back on the left to middle grey on the dead centre to pure white on the right. The vertical axis of the histogram represents how many pixels of our image contains that particular brightness value.
Let’s see a very simple example.
The spike in the above example truly represent the brightness value of that particular image. In a practical situation the camera takes into account the brightness value of all three primary colors and represents the brightness value in a graphical form.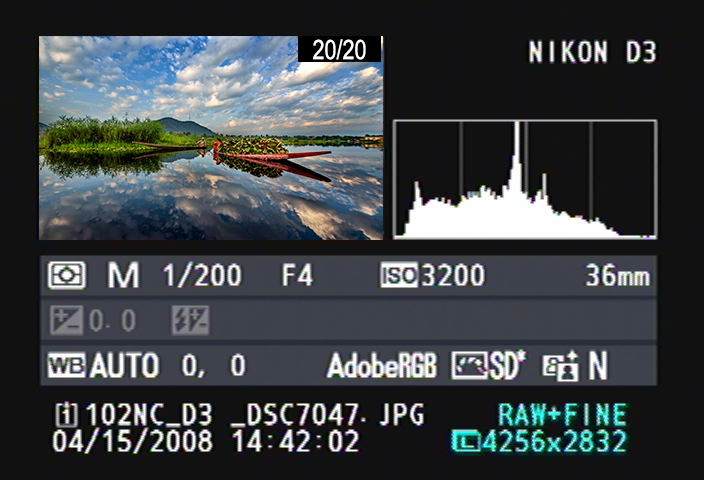
Since we understand that the histogram is the camera’s way of representing the brightness value, we can adjust the exposure value if the image is under or over expose.
Now let’s understand the color histogram. As we all know the image we see is made out of three primary colors. RED, GREEN and BLUE. If we add 100% of these three, we see white color. And we see black if we add 0%. So if we partially alter the value of each color, we see different colors. For example 50% of each three color will give us a grey color. So every individual mix of red, green and blue produces a specific color that has a specific brightness value. The color histogram lets you evaluate the brightness value of this individual color channel of our image.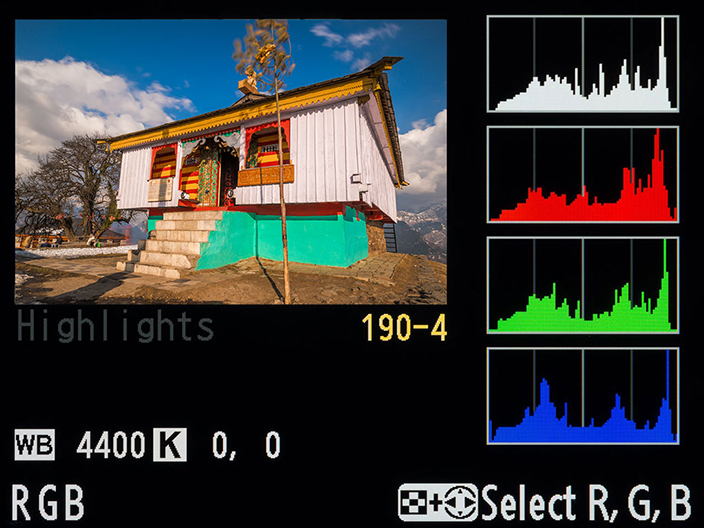
Now that we understand the basics of histogram, we must evaluate our image with the help of a histogram and correct if required. If you see the below example, you will understand how the histogram changes with the change of exposure by two stops. 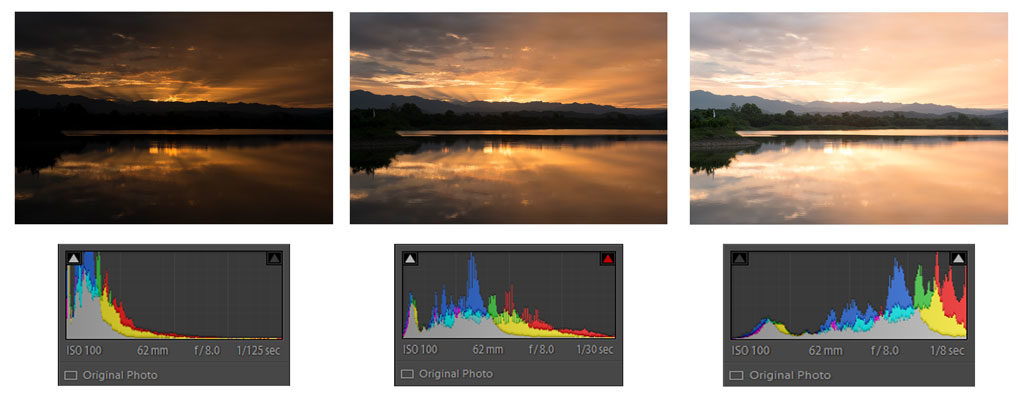
To sum up, the histogram is a fantastic tool to evaluate your exposure. While taking images, be sure to check your histogram to avoid any surprises when you look them on computer.


